Descriptiva
Descripcion de datos
- Agricolae es un complemento de R, utiliza los
resultados de la
función hist() y mediante funciones de agricolae se dispone de mas
información.
- Si los datos están agrupados en frecuencias, se puede utilizar la función graf.freq() de agricolae para obtener los mismos resultados de hist() y continuar con los gráficos y resúmenes estadísticos de agricolae.
Datos
agrupados
Inf Sup fi
10
15
2
15
20
6
20
25
8
25
30
7
30
35
3
35
40
4
library(agricolae)
x<-seq(10,40,5)
y<-c(2,6,8,7,3,4)
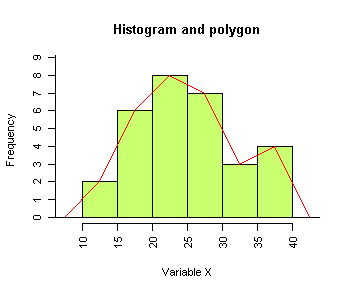
# Poligon and frecuency
h<-graph.freq(x,counts=y,col=colors()[86],xlab="
", ylab="Frequency",axes=FALSE)
axis(1,x,las=2)
axis(2,0:10)
polygon.freq(h,col="red",xlab="
", ylab="")
title( main="Histogram and polygon", xlab="Variable X")
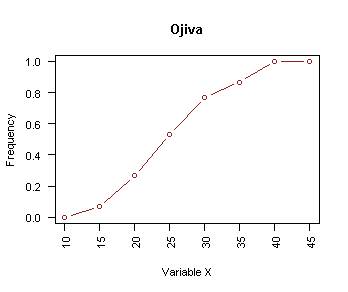
# Ojiva
ojiva<-ojiva.freq(h,col=colors()[36],type="b",
xlab="",ylab="",las=2)
title( main="Ojiva", xlab="Variable X", ylab="Frequency")
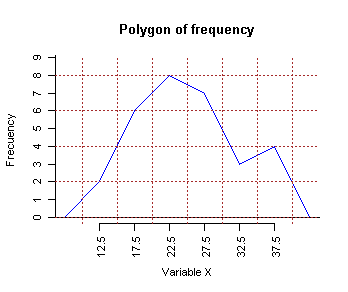
# only frequency polygon
h<-graph.freq(x,counts=y,border=FALSE,col=NULL, xlab=" ", ylab=" ",axes=FALSE)
title( main="Polygon of frequency" ,xlab="Variable
X", ylab="Frecuency")
axis(1,h$mids,las=2)
axis(2,0:10)
polygon.freq(h,col="blue", main="Ojiva of frequency",
xlab="Variable X", ylab="Frecuency")
grid(col="brown")
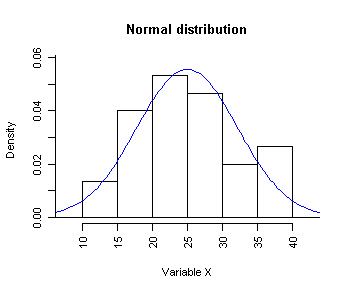
# Normal
h<-graph.freq(x, counts=y, xlab=" ",ylab=" ",axes=FALSE,frequency=3)
normal.freq(h,col="blue",frequency=3)
title(main="Normal distribution", xlab="Variable X", ylab="Density")
axis(1,h$breaks,las=2)
axis(2,seq(0,0.08,0.01))
#
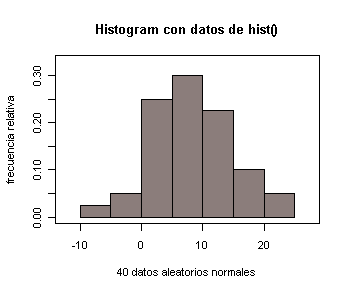
Como complemento de hist()
x<- round(rnorm(40,10,5), 2)
h<- hist(x,plot=FALSE)
h1<-graph.freq(h,col=colors()[483],xlab=" ",frequency=2)
title(main="Histogram con datos de hist()", ylab="frecuencia relativa",
xlab="40 datos aleatorios normales")
> h1
$breaks
[1] -5 0 5 10 15 20 25
$counts
[1] 1 7 12 14 5 1
$mids
[1] -2.5 2.5 7.5 12.5 17.5 22.5
$relative
[1] 0.025 0.175 0.300 0.350 0.125 0.025
$density
[1] 0.005 0.035 0.060 0.070 0.025 0.005
>
stat.freq(h1)
$variance
[1] 29.42308
$mean
[1] 9.75
$median
[1] 10
$mode
[- -] mode
[1,] 10 15 10.90909
> table.freq(h)
Inf Sup MC
fi fri Fi Fri
-10
-5 -7.5 1 0.025
1 0.025
-5 0
-2.5 2 0.050
3 0.075
0
5 2.5 10 0.250 13 0.325
5
10 7.5 12 0.300 25 0.625
10
15 12.5 9 0.225 34 0.850
15
20 17.5 4 0.100 38 0.950
20 25 22.5
2 0.050 40 1.000