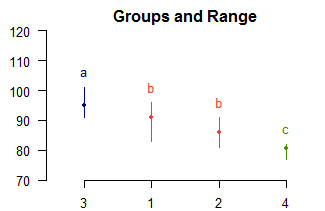
> out$groups
observation groups
3 95.0 a
1 91.0 b
2 86.0 b
4 80.5 c
> out$medians
Median Min Max Q25 Q75
1 91.0 83 96 89.00 92.00
2 86.0 81 91 83.25 89.75
3 95.0 91 101 93.50 98.00
4 80.5 77 82 78.75 81.00
> plot(out,ylim=c(70,120))
Changes version 1.2-7 (September 1, 2017)
In the post hoc tests,
the grouping of treatments are formed according to
the probability of the difference between treatments and the alpha level.
The affected functions were BIB.test, DAU.test, duncan.test, durbin.test,
friedman, HSD.test, kruskal, LSD.test, Median.test, PBIB.test, REGW.test,
scheffe.test, SNK. Test, waller.test and waerden.test. Now there is good
correspondence between the grouping and the pvalue.
> out<-with(corn,Median.test(observation,method,console=FALSE))
> out$groups
observation groups
3 95.0 a
1 91.0 b
2 86.0 b
4 80.5 c
> out$medians
Median Min Max Q25 Q75
1 91.0 83 96 89.00 92.00
2 86.0 81 91 83.25 89.75
3 95.0 91 101 93.50 98.00
4 80.5 77 82 78.75 81.00
> plot(out,ylim=c(70,120))

A new function (plot.group) is included in agricolae for the graphs of
treatment groups and their variation by range, interquartil range,
Standard deviation and standard error.
>
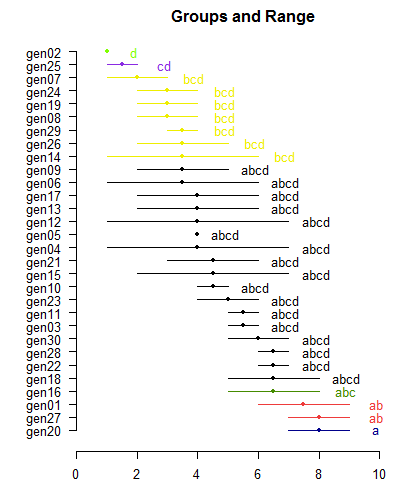
model <- with(dbook,PBIB.test(block, Genotype, replication, yield,
k=3, method="VC"))
Changes version 1.2-6 (August 04, 2017)
- Documentation.
Changes version 1.2-5 (July 22, 2017)
-
Add model object in
output PBIB.test function.
-
procedure duncan.test
is better, the limitations in convergence were corrected.
-
The influence in AMMI
(type=3) is relative neighbor graph as a sub-graph.
-
The post hoc
nonparametrics tests (kruskal, friedman, durbin and waerden)
are using the criterium Fisher's least significant difference (LSD)
Changes version 1.2-4 (June 16, 2016)
- Changes in the
package spdep influences changes in function plot.AMMI.
-
Concordance index in correlation
function(), additional arg (method="lin").
- New function orderPvalue(). Grouping the treatments in a comparison with
p.value minimum value (alpha)
- Test LSD.test and kruskal the adjust P.value (holm, hommel, hochberg,
bonferroni, BH, BY, fdr).
The comparison in pairs and groups give similar results.
> library(agricolae)
> data(sweetpotato)
> model<-aov(yield~virus, data=sweetpotato)
> out<-LSD.test(model, "virus", group=TRUE, p.adj= "holm")
> print(out$group)
trt mean M
1 oo 36.90000 a
2 ff 36.33333 a
3 cc 24.40000 b
4 fc 12.86667 c
> out<-LSD.test(model,
"virus", group=FALSE, p.adj= "holm")
> print(out$comparison)
Difference pvalue sig.
cc - fc 11.5333333 0.0484 *
cc - ff -11.9333333 0.0484 *
cc - oo -12.5000000 0.0484 *
fc - ff -23.4666667 0.0015 **
fc - oo -24.0333333 0.0015 **
ff - oo -0.5666667 0.8873
> data(corn)
> out<-with(corn,kruskal(observation,method,group=TRUE, main="corn", p.adj="holm"))
> print(out$group)
trt mean M
1 3 29.57143 a
2 1 21.83333 b
3 2 15.30000 c
4 4 4.81250 d
> out<-with(corn,kruskal(observation,method,group=FALSE,
main="corn", p.adj="holm"))
> print(out$comparison)
Difference pvalue sig.
1 - 2 6.533333 0.0079 **
1 - 3 -7.738095 0.0079 **
1 - 4 17.020833 0.0000 ***
2 - 3 -14.271429 0.0000 ***
2 - 4 10.487500 0.0003 ***
3 - 4 24.758929 0.0000
***
Changes version 1.2-3 (September 17, 2015)
-
News function: REGW.test and diffograph
-
REGW.test:
Ryan, Einot and Gabriel
and Welsch multiple range test.
Reference: Multiple
comparisons theory and methods. Departament of statistics
the Ohio State University. USA, 1996. Jason C. Hsu. Chapman Hall/CRC
> library(agricolae)
> data(sweetpotato)
> model<-aov(yield ~ virus, sweetpotato)
> comparison <- REGW.test(model, "virus", console=TRUE)
Study: model ~ "virus"
Ryan, Einot and Gabriel and Welsch multiple range test
for yield
Mean Square Error: 22.48917
virus, means
yield std r
Min Max
cc 24.40000 3.609709 3 21.7 28.5
fc 12.86667 2.159475 3 10.6 14.9
ff 36.33333 7.333030 3 28.0 41.8
oo 36.90000 4.300000 3 32.1 40.4
alpha: 0.05 ; Df Error: 8
Critical Range
2 3 4
10.62212 11.06417 12.39967
Means with the same letter are not significantly different.
Groups, Treatments and means
a oo 36.9
a ff 36.33
b cc 24.4
c fc 12.87
> x <- REGW.test(model,
"virus", group=FALSE)
> x$comparison
Difference
pvalue sig. LCL
UCL
cc - fc 11.5333333 0.0349644299 * 0.9112173
22.155449
cc - ff -11.9333333 0.0299189739 * -22.5554494 -1.311217
cc - oo -12.5000000 0.0290886174 * -23.5641696 -1.435830
fc - ff -23.4666667 0.0007768657 *** -34.5308363 -12.402497
fc - oo -24.0333333 0.0011620946 ** -36.4330031 -11.633664
ff - oo -0.5666667 0.9872913432 -11.1887827
10.055449
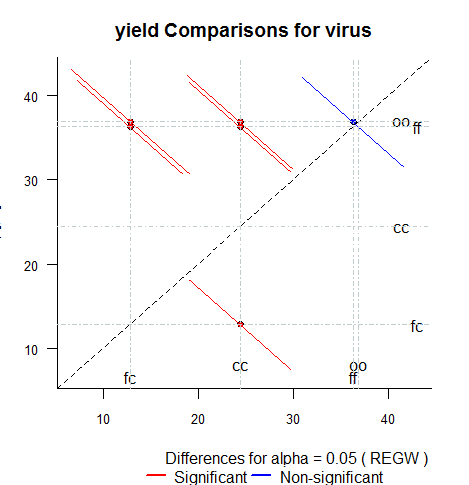
- diffograph: Plotting the multiple comparison of means.
Reference: Multiple
comparisons theory and methods. Departament of statistics
the Ohio State University. USA, 1996. Jason C. Hsu. Chapman Hall/CRC
Mean-Mean scatter plot
representation of the test comparison: LSD, HSD, Duncan,
SNK, REGW, Scheffe, Kruskal-Wallis, Friedman and Wardean.
> x <- REGW.test(model,
"virus", group=FALSE)
> diffograph(x,cex=1,lwd=1.5)
Changes version 1.2-2 (August 12, 2015)
-
Now in the frequency tables shows the
relative frequency as a percentage,
the function is tables.freq or summary(graph.freq or hist object)
-
The histogram class is added to
graph.freq and it can used the packages Histogram Tools.
-
Now in the frequency tables shows the
relative frequency as a percentage,
the function is tables.freq or summary(graph.freq or hist object)
- design.bib: Optimal design, use function optBlock(algDesign)
> str(design.bib)
function (trt, k, r = NULL, serie = 2, seed = 0, kinds = "Super-Duper",
maxRep = 20)
> trt<-LETTERS[1:7]
> design <-
design.bib(trt,k=4, r=2)
Change r by 4, 8, 12, 16, 20 ...
> design <-
design.bib(trt,k=4, r=4)
Parameters BIB
==============
Lambda : 2
treatmeans : 7
Block size : 4
Blocks : 7
Replication: 4
Efficiency factor 0.875
<<< Book >>>
> design$sketch
[,1] [,2] [,3] [,4]
[1,] "A" "F" "C" "E"
[2,] "A" "F" "D" "B"
[3,] "D" "G" "E" "F"
[4,] "E" "A" "G" "B"
[5,] "B" "C" "D" "E"
[6,] "A" "C" "D" "G"
[7,] "C" "B" "G" "F"
-
Now in the frequency table shows the relative frequency as a percentage,
the function is table.freq or summary( graph.freq or hist object)
>
x<-rnorm(40,mean=10,sd=5)
> h<-graph.freq(x,plot=FALSE)
> summary(h)
Lower Upper Main Frequency Percentage CF CPF
1 2.0 4.8 3.4
3 7.5 3 7.5
2 4.8 7.6 6.2
8 20.0 11 27.5
3 7.6 10.4 9.0 10
25.0 21 52.5
4 10.4 13.2 11.8 9
22.5 30 75.0
5 13.2 16.0 14.6 7
17.5 37 92.5
6 16.0 18.8 17.4 3
7.5 40 100.0
- Option sketch in design: rbcd, lsd, graeco, youden, bib
>
design<-design.rcbd(trt=LETTERS[1:4],r=5,seed=37)
> print(design$sketch)
[,1] [,2] [,3] [,4]
[1,] "D" "A" "B" "C"
[2,] "A" "C" "D" "B"
[3,] "D" "B" "C" "A"
[4,] "B" "D" "C" "A"
[5,] "C" "A" "D" "B"
- The histogram class is added to graph.freq and it can use the package HistogramTools.
>
x<-rnorm(40,mean=10,sd=5)
> h<-graph.freq(x,plot=FALSE)
> library(HistogramTools)
> ApproxQuantile(h, c(.05, .95))
5% 95%
4.2350 16.6685
Changes version 1.2-1 (August 25, 2014)
- index.AMMI: stability value (ASV) and Yield stability index (YSI),
> data(plrv)
> attach(plrv)
> model<- AMMI(Locality, Genotype, Rep, Yield, console=FALSE)
> detach(plrv)
> Idx<-index.AMMI(model)
> # Crops with better response and improved stability according AMMI.
> print(Idx[order(Idx[,4]),])
ASV YSI rASV rYSI
means
141.28 3.1531170 24 23 1 39.75624
Unica 3.3470545 27 25 2 39.10400
319.20 4.8741897 30 27 3 38.75767
235.6 3.3065468 28 24 4 38.63477
...
Desiree 5.537413 56 28 28 16.15569
- Design youden. new function. Example: Youden 4-row and 3-col (4-treatments)
> varieties<-c("perricholi","yungay","maria
bonita","tomasa")
> outdesign <-design.youden(varieties,r=3,serie=2,seed=23)
> youden <- outdesign$book
> trt <-as.character(youden[,4])
> dim(trt) <-c(3,4)
> print(t(trt))
[,1] [,2] [,3]
[1,] "maria bonita" "perricholi" "tomasa"
[2,] "yungay" "tomasa"
"maria bonita"
[3,] "tomasa" "yungay"
"perricholi"
[4,] "perricholi" "maria bonita" "yungay"
- PBIB.test: Now the
PBIB.test function uses missing values.
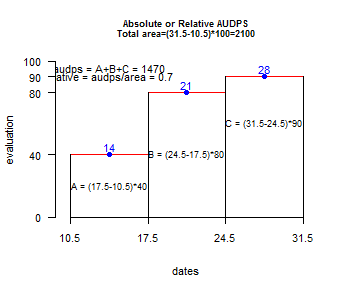
- audps:
The Area Under the Disease Progress Stairs
Changes version 1.2-0 (June 24, 2014)
- AMMI:
aditional parameters PC=FALSE or TRUE,
output principal components,
- plot.AMMI: graphic aditional
parameters lwd = 1.8, length = 0.1 to arrow function
-
console=FALSE or TRUE, output in
console:
simulation.model,
resampling.model, stability.par, stability.nonpar.
Changes version 1.1-9 (June 16, 2014)
- AUDPC the evaluation parameter now can be numeric vector. To see help(audpc)
> evaluation<-
c(10,50,60,80,90) # percentage
> dates <- c(1,8,15,22,29) # dates evaluation
> audpc(evaluation,dates)
1680
- Change name ogive.freq by ojiva.freq, the parameters are same.- PBIB new parameter: group=TRUE
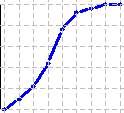 |
> par(cex=0.4,mar=c(0,0,0,0)) > x<-rnorm(50,10,3) > h<-graph.freq(x,plot=FALSE) > Og<-ogive.freq(h,col="blue",lwd=3) |
- Now vignettes in agricolae
- Changed parameters by default "first = TRUE" in designs: rcbd, ab, split and ls
> # randomizes the
first repeat
> trt <- LETTERS[1:6]
> plan <- design.rcbd(trt,r=4,first = TRUE)
> head(plan$book)
plots block trt
1 101 1 E
2 102 1 B
3 103 1 A
4 104 1 C
5 105 1 F
6 106 1 D
- PBIB new parameter: group=TRUE
PBIB.test(block,trt,replication,y,k, method=c("REML","ML","VC"),test =
c("lsd","tukey"), alpha=0.05, console=FALSE, group=TRUE)
when you have many treatments to use group=FALSE.
- design.rcbd(..., continue=FALSE)
continue=TRUE or FALSE, continuous numbering of plot
- Median.test. New function for multiple comparisons of treatments with Median.
> trt<-c(rep(1,9),rep(2,10),rep(3,7),rep(4,8))
>
y<-c(83,91,94,89,89,96,91,92,90,91,90,81,83,84,83,88,91,89,84,101,100,91,93,96,95,94,78,82,81,77,79,81,80,81)
> comparison<-Median.test(y,trt)
The Median Test for y ~ trt
Chi-square = 17.54306 DF = 3 P.value 0.00054637
Median = 89
Median Chisq
pvalue sig
1 and 2 89.0 2.554444 0.1099844702
1 and 3 92.5 6.349206 0.0117433823 *
1 and 4 83.0 13.432099 0.0002473552 ***
2 and 3 91.0 13.246753 0.0002730524 ***
2 and 4 82.5 14.400000 0.0001478023 ***
3 and 4 82.0 15.000000 0.0001075112 ***
-
Now, AMMI function checks the mínimum number of environments and genotypes.
Now use console=TRUE or
FALSE to output in screen. the graphs are produced by the plot function.
-
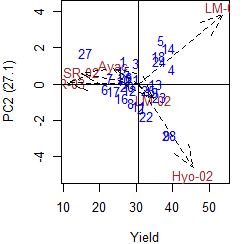
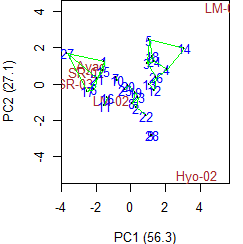
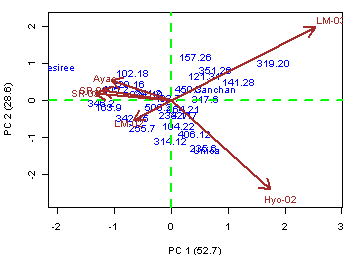
plot.AMMI() or plot() functions generate plot of the AMMI with others principal
components.
type=1 (biplot), type=2 (triplot)
and type=3 (influence genotype)
> data(plrv)
> attach(plrv)
> model<- AMMI(Locality, Genotype, Rep, Yield, console=FALSE)
> detach(plrv)
> par(cex=0.8,mar=c(4,4,0,1))
> plot(model,0,2,angle=20,ecol="brown",number=TRUE)
> plot(model,1,2,angle=20,ecol="brown",number=TRUE,type=3)
 |
 |
Changes version 1.1-8 (february 21, 2014)
- Changes in designs function: output design: parameters, book, statistics and sketch.
> library(agricolae)
> # Example randomized complete block design in potato
> varieties <- c("tomasa","huayro", "revolucion", "perricholi")
> blocks <- 5
> outdesign <- design.rcbd(varieties, r=blocks, serie=2)
> fieldbook <- outdesign$book
> head(fieldbook)
plots block varieties
1 101 1 tomasa
2 102 1 huayro
3 103 1 revolucion
4 104 1 perricholi
5 201 2 tomasa
6 202 2 perricholi
> # restore design
> seed<-outdesign$parameters$seed
> newdesign <- design.rcbd(varieties, r=blocks, seed=seed, serie=2)
> newbook <- newdesign$book
> head(newbook)
plots block varieties
1 101 1 tomasa
2 102 1 huayro
3 103 1 revolucion
4 104 1 perricholi
5 201 2 tomasa
6 202 2 perricholi
> # lattice design
> trt<-letters[1:16]
> outdesign <- design.lattice(trt, r=3)
Lattice design, triple 4 x 4
Efficiency factor
(E ) 0.7692308
<<< Book >>>
> book <- outdesign$book
> sketch <- outdesign$sketch
> print(sketch)
$rep1
[,1] [,2] [,3] [,4]
[1,] "i" "a" "e" "o"
[2,] "n" "g" "b" "h"
[3,] "p" "k" "l" "m"
[4,] "j" "f" "d" "c"
$rep2
[,1] [,2] [,3] [,4]
[1,] "i" "n" "p" "j"
[2,] "a" "g" "k" "f"
[3,] "e" "b" "l" "d"
[4,] "o" "h" "m" "c"
$rep3
[,1] [,2] [,3] [,4]
[1,] "i" "b" "k" "c"
[2,] "e" "n" "m" "f"
[3,] "a" "h" "l" "j"
[4,] "o" "g" "p" "d"
> head(book)
plots r block trt
1 101 1 1 i
2 102 1 1 a
3 103 1 1 e
4 104 1 1 o
5 105 1 2 n
6 106 1 2 g
- New function: zigzag(outdesign) re-number plots in serpentine by blocks
> # Apply case
before.
> newbook<-zigzag(outdesign)
> array(newbook$plots,c(4,4,3)) -> X
> t(X[,,1])
[,1] [,2] [,3] [,4]
[1,] 101 102 103 104
[2,] 108 107 106 105
[3,] 109 110 111 112
[4,] 116 115 114 113
> t(X[,,2])
[,1] [,2] [,3] [,4]
[1,] 201 202 203 204
[2,] 208 207 206 205
[3,] 209 210 211 212
[4,] 216 215 214 213
> t(X[,,3])
[,1] [,2] [,3] [,4]
[1,] 301 302 303 304
[2,] 308 307 306 305
[3,] 309 310 311 312
[4,] 316 315 314 313
Changes version 1.1-7
(January 6, 2014)
- Changes in histogram: graph.freq, join.freq, ojiva.freq: Position axes and values:
> library(agricolae)
> x<-rnorm(50,20,6)
> h<-graph.freq(x,frequency=2,main="relative frequency",col=colors()[21])
> round(summary(h),2)
Lower Upper Main freq relative CF
RCF
7.0 10.9 8.95 1
0.02 1 0.02
10.9 14.8 12.85 7 0.14
8 0.16
14.8 18.7 16.75 9 0.18 17
0.34
18.7 22.6 20.65 17 0.34 34 0.68
22.6 26.5 24.55 13 0.26 47 0.94
26.5 30.4 28.45 1 0.02 48
0.96
30.4 34.3 32.35 2 0.04 50
1.00
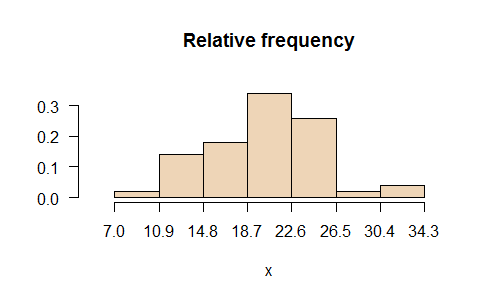
Join 6 and 7 class
> h1<-join.freq(h,6:7)
> plot(h1,frequency=2,main="New relative frequency",density=8)
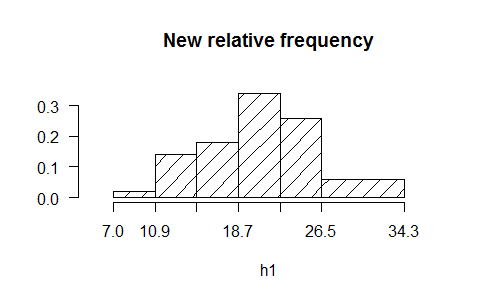
> round(summary(h1),2)
Lower Upper Main freq relative
CF RCF
7.0 10.9 8.95 1 0.02
1 0.02
10.9 14.8 12.85 7 0.14
8 0.16
14.8 18.7 16.75 9 0.18
17 0.34
18.7 22.6 20.65 17 0.34 34
0.68
22.6 26.5 24.55 13 0.26 47
0.94
26.5 34.3 30.40 3 0.06
50 1.00
>
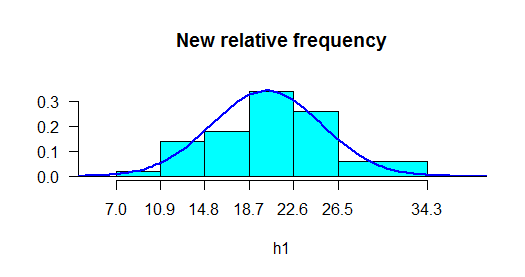
plot(h1,frequency=2,main="New relative frequency",col="cyan")
> normal.freq(h1,col="blue",frequency=2,lwd=2
- Changes in functions of mean comparison of treatments test: LSD.test, HSD.test, waller.test,.. include standard deviation an plot:
> library(agricolae)
> data(sweetpotato)
> model<-aov(yield ~ virus, sweetpotato)
> comparison <- duncan.test(model, "virus", console=TRUE)
Study: model ~ "virus"
Duncan's new multiple range test
for yield
Mean Square Error: 22.48917
virus, means
yield std r
Min Max
cc 24.40000 3.609709 3 21.7 28.5
fc 12.86667 2.159475 3 10.6 14.9
ff 36.33333 7.333030 3 28.0 41.8
oo 36.90000 4.300000 3 32.1 40.4
alpha: 0.05 ; Df Error: 8
Critical Range
2 3 4
8.928965 9.304825 9.514910
Means with the same letter are not significantly different.
Groups, Treatments and means
a oo 36.9
a ff 36.33
b cc 24.4
c fc 12.87
>
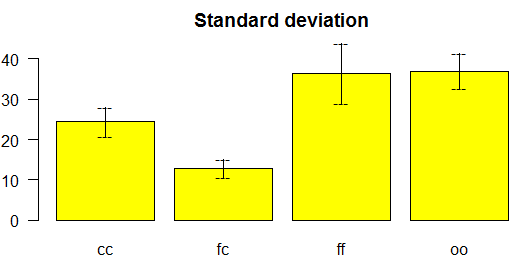
bar.err(comparison$mean,variation="SD", col="yellow",las=1,ylim=c(0,45),
main="Standard deviation")
Changes version 1.1-6 (December 2, 2013)
- Changes in designs: design.ab, design.split, design.alpha, design.bib, design.crd, design.cyclic, design.dau, design.graeco, design.lattice, design.lsd, design.rcbd, design.strip. changes in the numbering of the plots:
> library(agricolae)
> trt<-c(3,2) # factorial 3x2
> rcbd <-design.ab(trt, r=3, serie=2)
> head(rcbd,10) # print of the field book
plots block A B
1 101 1 1 1
2 102 1 1 2
3 103 1 2 1
4 104 1 2 2
5 105 1 3 1
6 106 1 3 2
7 201 2 1 2
8 202 2 2 2
9 203 2 1 1
10 204 2 3 1
>
- Delete functions random.ab(), fact.nk(); now design.ab() generate a factorial
pqr.. n factors with levels different and design: rcbd, crd and latin square.
> # factorial 2 x 2 x 2
with 5 replications in completely randomized design.
> trt<-c(2,2,2)
> crd<-design.ab(trt, r=5, serie=2,design="crd",seed=83)
> head(crd)
plots r A B C
1 101 1 2 1 1
2 102 1 2 1 2
3 103 1 2 2 2
4 104 1 1 2 2
5 105 2 2 2 2
6 106 1 2 2 1
> str(crd)
'data.frame': 40 obs. of 5 variables:
$ plots: num 101 102 103 104 105 106 107 108 109 110 ...
$ r : int 1 1 1 1 2 1 1 1 2 2 ...
$ A : Factor w/ 2 levels "1","2": 2 2 2 1 2 2 1 1 2 1 ...
$ B : Factor w/ 2 levels "1","2": 1 1 2 2 2 2 2 1 1 2 ...
$ C : Factor w/ 2 levels "1","2": 1 2 2 2 2 1 1 1 1 2 ...
>
- Changes in
PBIB.test, now require nlme() function to method REML and ML, more information
in the output.
> require(agricolae)
> require(MASS) # method = VC in PBIB.test
> # require(nlme) # method = REML
or LM in PBIB.test
Changes version 1.1-5 (November 2, 2013)
- Changes in LSD.test, HSD.test, duncan.test, SNK.test, scheffe.text, kruskal, friedman, weader.test, BIB.test, PBIB.test and waller.test. Now it is necessary use console=TRUE to output, in other case noprint, default is console=FALSE:
> library(agricolae)
> data(sweetpotato)
> model<-aov(yield~virus, data=sweetpotato)
> out <- LSD.test(model,"virus", p.adj="bonferroni")
> names(out)
[1] "statistics" "parameters" "means" "comparison" "groups"
> out$groups
trt means M
1 oo 36.90000 a
2 ff 36.33333 a
3 cc 24.40000 ab
4 fc 12.86667 b
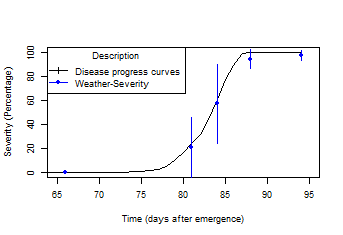
- New function: lateblight. Mathematical model that simulates the effect of weather, host growth and resistance, and fungicide use on asexual development and growth of Phytophthora infestans on potato foliage
See example
> model<-lateblight(WS,
Cultivar,ApplSys, InocDate, LGR,IniSpor,SR,IE, LP,
MatTime='LATESEASON',InMicCol,main=main,type="l",xlim=c(65,95),lwd=1.5,
xlab="Time (days after emergence)", ylab="Severity (Percentage)")
Changes version 1.1-4 (April 9, 2013)
- Changes in kruskal and LSD, the treatments group can calculate also with different sample size and replications.
- Changes in tapply.stat, It is better in the order when the categorical is numeric.
> data(growth)
> attach(growth)
> str(growth)
'data.frame': 30 obs. of 3 variables:
$ place : Factor w/ 2 levels "L1","L2": 1 1 1 1 1 1 1 1 1 1 ...
$ slime : int 6 7 7 6 10 9 17 17 17 18
...
$ height: num 9.4 9.2 10.2 12.5 12.2 10.5 12.1 10.2 11.4 10.1 ...
> A<-tapply.stat(height,
growth[,2:1], function(x) mean(x,na.rm=TRUE))
> str(A)
'data.frame': 16 obs. of 3 variables:
$ slime : num 5 6 6 7 7 9 9 10 10 11 ...
$ place : Factor w/ 2 levels "L1","L2": 1 1 2 1 2 1 2 1 2 2 ...
$ height: num 8.43 10.95 11.35 9.38 12 ...
> print(A)
slime place height
1 5 L1 8.433333
2 6 L1 10.950000
3 6 L2 11.350000
4 7 L1 9.375000
5 7 L2 12.000000
6 9 L1 10.500000
7 9 L2 12.400000
8 10 L1 12.200000
9 10 L2 10.600000
10 11 L2 11.433333
11 12 L2 12.500000
12 13 L2 11.500000
13 14 L2 11.500000
14 15 L2 11.900000
15 17 L1 11.233333
16 18 L1 10.100000
Changes version 1.1-3 (December 21, 2012)
- Changes in comparison
treatments (LSD, HSD, Waller, SNK, scheffe, friedman,
kruskal, warden, DAU, BIB and PBIB) and functions bar.group and bar.err.
Now, the output
has information.
model <-aov (yield ~ block + clone * nitrogen, data = A)
out <-LSD.test (model, c("clone", "nitrogen"))
names(out)
[1] "statistics" "parameters" "means" "comparison" "groups"
out$statistics
Mean CV MSerror
LSD
11.63889 9.36279 1.1875 1.590341
out$parameters
Df ntr t.value
24 9 2.063899
out$means
yield std.err r LCL
UCL Min. Max.
c1:n1 7.50 0.6454972 4 6.167759 8.832241 6 9
c1:n2 8.50 0.6454972 4 7.167759 9.832241 7 10
c1:n3 9.00 0.4082483 4 8.157417 9.842583 8 10
c2:n1 13.50 0.6454972 4 12.16775 14.832241 12 15
...
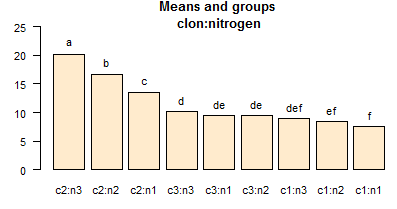
out$groups
trt means M
1 c2:n3 20.25 a
2 c2:n2 16.75 b
3 c2:n1 13.50 c
4 c3:n3 10.25 d
par (mar = c (3,3,2,0),cex=0.7)
bar.err (out$means, variation="range",ylim = c(0, 25), col=colors()[15],space=2,bar=FALSE, las=1)
title (main = "Means and groups \nclon:nitrogen")
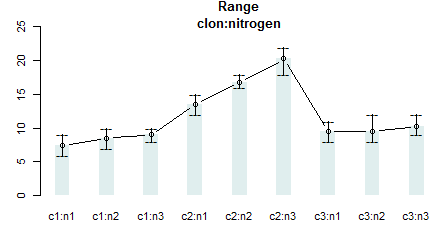
title (main = "Range\nclon:nitrogen")
bar.group(out$groups, ylim
= c(5, 25), col = colors()[15],las=1)
title (main = "Means and groups \nclon:nitrogen")
out <-LSD.test (model, c("clone", "nitrogen"),
group=FALSE)
head(out$comparison)
Difference pvalue sig.
LCL UCL
c1:n1-c1:n2 -1.00 2.067011e-01
-2.590341 0.59034065
c1:n1-c1:n3 -1.50 6.337225e-02 . -3.090341
0.09034065
c1:n1-c2:n1 -6.00 5.075500e-08 *** -7.590341
-4.40965935
c1:n1-c2:n2 -9.25 1.240452e-11 *** -10.840341
-7.65965935
c1:n1-c2:n3 -12.75 1.265654e-14 *** -14.340341 -11.15965935
c1:n1-c3:n1 -2.00 1.586340e-02 * -3.590341
-0.40965935
- Comparison treatments in factorial treatment (LSD, HSD, Waller, SNK, scheffe)
yield <-scan (text =
"6 7 9 13 16 20 8 8 9
7 8 8 12 17 18 10 9 12
9 9 9 14 18 21 11 12 11
8 10 10 15 16 22 9 9 9 "
)
block <-gl(4, 9)
clone <-rep(gl (3, 3, labels = c("c1", "c2", "c3")), 4)
nitrogen <-rep(gl(3, 1, labels = c("n1", "n2", "n3")), 12)
A <-data.frame(block, clone, nitrogen, yield)
head (A)
block clone nitrogen yield
1 1 c1
n1 6
2 1 c1
n2 7
3 1 c1
n3 9
4 1 c2
n1 13
5 1 c2
n2 16
6 1 c2
n3 20
model <-aov (yield ~ block + clone * nitrogen, data = A)
compare <-LSD.test (model, c("clone", "nitrogen"))
Least Significant
Difference 1.590341
Means with the same letter are not significantly different.
Groups, Treatments and means
a c2:n3 20.25
b c2:n2 16.75
c c2:n1 13.5
d c3:n3 10.25
de c3:n1 9.5
de c3:n2 9.5
def c1:n3 9
ef c1:n2 8.5
f c1:n1 7.5
Changes version 1.1-2 (July 06, 2012)
- Comparison treatments (all functions)
Example (LSD.test)
Groups, Treatments and
means
a oo 36.9
a ff 36.33
ab cc 24.4
b fc 12.87
Difference pvalue sig LCL
UCL
cc - fc 11.5333333 0.105827 -1.937064
25.0037305
cc - ff -11.9333333 0.090439 . -25.403730 1.5370638
cc - oo -12.5000000 0.072531 . -25.970397 0.9703971
fc - ff -23.4666667 0.001814 ** -36.937064 -9.9962695
fc - oo -24.0333333 0.001545 ** -37.503730 -10.5629362
ff - oo -0.5666667 1.000000 -14.037064 12.9037305
- Upgrade PBIB.test
Comparison treatments in groups similar to SAS Method estimate: REML, ML and variance-components (VC)
PBIB.test(block, trt, replication, y, k,
method = c("lsd", "tukey"), alpha = 0.05,
estimate = c("REML", "ML", "VC"), group = TRUE)
output
ANALYSIS PBIB:
yield
Class level information
block : 20
Genotype : 30
Number of observations: 60
Estimation Method: REML
Parameter Estimates
Variance
block:replication 2.834033
replication 0.000000
Residual 2.003098
Fit Statistics
-2 Res Log Likelihood 147.6594
AIC 215.6594
BIC 286.8671
Analysis of Variance Table
Response: yield
Df Sum Sq
Mean Sq F value Pr(>F)
Genotype 29 72.006 2.4830 1.2396 0.3668
Residuals 11 22.034 2.0031
coefficient of variation: 31.2 %
yield Means: 4.533333
Parameters PBIB
.
Genotype 30
block size 3
block/replication 10
replication 2
Efficiency factor 0.6170213
Means with the same letter are not significantly different.
Groups, Treatments and means
a 20 7.729
ab 13 6.715
ab 1 6.505
abc 8 6.192
abcd 24 6.032
abcd 23 5.735
abcd 10 5.473
abcd 16 5.455
abcd 21 5.14
abcd 22 5.069
abcd 4 4.874
abcd 3 4.794
abcd 14 4.742
abcd 15 4.587
abcd 27 4.563
abcd 7 4.424
abcd 5 4.286
abcd 19 4.198
abcd 6 4.165
abcd 25 3.978
abcd 17 3.943
bcd 2 3.628
bcd 28 3.495
bcd 11 3.379
bcd 26 3.341
bcd 9 3.052
bcd 30 3
bcd 12 2.879
cd 29 2.44
d 18 2.186
<<< to see the objects: means, comparison and groups. >>>
> detach(dbook)
> head(model$comparison)
Difference stderr
pvalue
1 - 2 2.876555 1.844369 0.147134
1 - 3 1.711132 1.576446 0.300944
1 - 4 1.630873 1.727016 0.365282
1 - 5 2.218796 1.853044 0.256324
1 - 6 2.339326 1.828367 0.227064
1 - 7 2.080720 1.855004 0.285888
> head(model$means)
trt means mean.adj N
std.err
geno1 1 7.5 6.504752 2 1.313644
geno10 2 4.5 3.628197 2 1.313644
geno11 3 5.5 4.793619 2 1.310726
geno12 4 4.0 4.873879 2 1.313644
geno13 5 4.0 4.285956 2 1.313644
geno14 6 3.5 4.165426 2 1.310726
>
head(model$groups)
Genotype mean.adj M N std.err
20 geno27 7.728746 a 2 1.313644
13 geno20 6.714883 ab 2 1.310726
1 geno1 6.504752 ab 2 1.313644
8 geno16 6.192468 abc 2 1.310726
24 geno30 6.032067 abcd 2 1.310726
23 geno3 5.734592 abcd 2 1.310726
Changes version 1.1-1
(April 05, 2012)
- Update scheffe.test
Comparison treatments in groups similar to SAS
Changes version 1.1-0 (March 28, 2012)
All comparison treatments (<= 61 groups)
- DAU.test. comparison treatment (groups)
block<-c(rep("I",7),rep("II",6),rep("III",7))
trt<-c("A","B","C","D","g","k","l","A","B","C","D","e","i","A","B","C","D","f","h","j")
yield<-c(83,77,78,78,70,75,74,79,81,81,91,79,78,92,79,87,81,89,96,82)
model<- DAU.test(block,trt,yield,method="lsd", group=TRUE)
Groups, Treatments and means
a  h 93.5
ab f 86.5
ab A 84.6
ab D 83.3
ab C 82
ab j 79.5
ab B 79
ab e 78.25
ab k 78.25
ab i 77.25
ab l 77.25
 b g 73.25
- PBIB.test. comparison treatment (groups)
see example ? PBIB.test
> model <- PBIB.test(block, trt, replication, yield, k=3, group=TRUE)
Groups, Treatments and means
a 	27 7.72
ab 	20 6.72
ab 	1  6.51
abc 	16 6.19
....
  cd 	8  2.44
   d 	25 2.17
Changes version 1.1-0 (February 28, 2012)
- design.rcbd.
randomize first block= FALSE or TRUE
design.rcbd(trt, r, number = 1, seed =
0, kinds = "Super-Duper", first=FALSE)
> example(design.rcbd)
dsgn.r> print(t(plots))
[,1] [,2] [,3] [,4] [,5]
[1,] 101 102 103 104 105
[2,] 110 109 108 107
106
[3,] 111 112 113 114 115
[4,] 120 119 118 117 116
[5,] 121 122 123 124 125
[6,] 130 129 128 127 126
dsgn.r> print(t(trt))
[,1] [,2] [,3] [,4] [,5]
[1,] "A" "B" "C" "D" "E"
[2,] "D" "B" "E" "A" "C"
[3,] "B" "D" "C" "A" "E"
[4,] "E" "D" "A" "B" "C"
[5,] "C" "B" "D" "E" "A"
[6,] "E" "C" "D" "A" "B"
- PBIB.test grouping. see
example.
PBIB.test(block,trt,replication,y,k, method = c("lsd","tukey"), alpha=0.05,
group=TRUE)
> model$groups
trt mean.adj M N std.err
27 7.729927 a 2 1.323025
20 6.728215 ab 2 1.320192
1 6.514615 ab 2 1.323025
16 6.195995 abc 2 1.320192
...
- path.analysis. output
> model<-path.analysis(cor.x,cor.y)
> model
$Coeff
EC
Ca K2
Cu
EC -0.19495296 -0.08486615 -0.06659364 0.006412745
Ca -0.04483918 -0.36898324 -0.05327491 -0.022902662
K2 -0.08772883 -0.13283397 -0.14798587 -0.011451331
Cu 0.02729341 -0.18449162 -0.03699647 -0.045805324
$Residual
[1] 0.6856863
- graph.freq - summary()
> limits <-seq(10,40,5)
> frequencies <-c(2,6,8,7,3,4)
> #startgraph
> h<-graph.freq(limits,counts=frequencies,col="bisque",xlab="Classes")
> round(summary(h),2)
Lower Upper Main frequency relative CF RCF
10 15 12.5 2
0.07 2 0.07
15 20 17.5 6
0.20 8 0.27
20 25 22.5 8
0.27 16 0.53
25 30 27.5 7
0.23 23 0.77
30 35 32.5 3
0.10 26 0.87
35 40 37.5 4
0.13 30 1.00
Changes version 1.1-0 (February 16, 2011)
- strip.plot example simple effects. see example.
Changes version 1.1-0 (December 2, 2010)
- bar.err() color bar is black
- ssp.plot. splip-splip plot analysis. see
example.
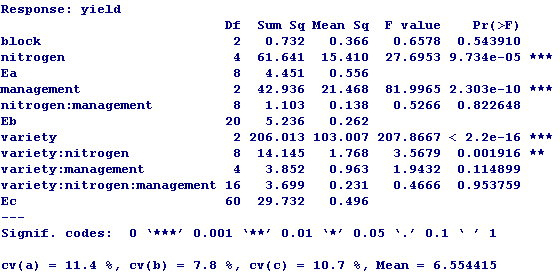
- sp.plot. split plot analysis
- strip.plot. strip plot analysis (update)
- kruskal. p.adjusted: holm, hochberg,
bonferroni, BH, BY, fdr.
library(agricolae)
data(corn)
attach(corn)
comparison<-kruskal(observation,method,p.adj="bon",group=FALSE, main="corn")
detach(corn)
P value adjustment method:
bonferroni
Comparison between treatments mean of the ranks
Difference pvalue sig
LCL UCL
1 - 2 6.533333 0.042564 * 0.1474712 12.91920
3 - 1 7.738095 0.023820 * 0.7339731 14.74222
1 - 4 17.020833 0.000000 *** 10.2674375 23.77423
3 - 2 14.271429 0.000012 *** 7.4222351 21.12062
2 - 4 10.487500 0.000576 *** 3.8949224 17.08008
3 - 4 24.758929 0.000000 *** 17.5658367 31.95202
- data(haynes): the data for the AUDPC.
- Update plot AMMI()
Changes version 1.0-9 (February 24, 2010)
- scheffe.test: Scheffe's multiple
comparisons.
- Analysis Augmented block Design
- kruskal and friedman: upgrade, confidence
intervals
- BIB.test: upgrade, methods = Duncan and
SNK
- duncan.test: Duncan's new multiple range
test
- SNK.test: Student-Newman-Keuls (SNK)
- LSD.test, HSD.test, Waller.test. With additional parameter model and
confidence intervals.
- Now in consensus of dendrogram, now with distance method "gower" of DAISY in
library cluster.
library(agricolae)
data(sweetpotato)
model<-aov(yield~virus,data=sweetpotato)
sheffe.test(model,"virus",group=FALSE)
SNK.test(model,"virus")
waller.test(model,"virus")
HSD.test(model,"virus")
LSD.test(model,"virus")
SNK.test(model,"virus", group=F)
duncan.test(model,"virus",alpha=0.01)
comparison <- waller.test(model,"virus")
bar.group(comparison,col="blue",density=6,ylim=c(0,max(sweetpotato$yield)))
library(agricolae)
library(cluster)
data(pamCIP)
# only code
rownames(pamCIP)<-substr(rownames(pamCIP),1,6)
library(cluster)
par(cex=0.7)
output<-consensus( pamCIP,distance="gower", method="complete",nboot=100)
> comparison <-
scheffe.test(model,"virus",group=FALSE, main="Yield of sweetpotato\nDealt with
different virus")
Study: Yield of sweetpotato
Dealt with different virus
Scheffe Test for yield
Mean Square Error : 22.48917
virus, means
yield std.err replication
cc 24.40000 2.084067 3
fc 12.86667 1.246774 3
ff 36.33333 4.233727 3
oo 36.90000 2.482606 3
alpha: 0.05 ; Df Error: 8
Critical Value of F: 4.066181
Comparison between treatments means
Difference pvalue sig
LCL UCL
cc - fc 11.5333333 0.097816 . -1.990350 25.05702
ff - cc 11.9333333 0.085487 . -1.590350 25.45702
oo - cc 12.5000000 0.070607 . -1.023684 26.02368
ff - fc 23.4666667 0.002331 ** 9.942983 36.99035
oo - fc 24.0333333 0.001998 ** 10.509650 37.55702
oo - ff 0.5666667 0.999099 -12.957017 14.09035
SNK.test(model,"virus",main="virus in
sweetpotato")
Study: virus in sweetpotato
Student Newman Keuls Test
for yield
Mean Square Error: 22.48917
virus, means
yield std.err replication
cc 24.40000 2.084067 3
fc 12.86667 1.246774 3
ff 36.33333 4.233727 3
oo 36.90000 2.482606 3
alpha: 0.05 ; Df Error: 8
Critical Range
2 3
4
8.928965 11.064170 12.399670
Means with the same letter are not significantly different.
Groups, Treatments and means
a oo
36.9
a ff
36.33333
b cc
24.4
c fc 12.86667
SNK.test(model,"virus",main="virus in sweetpotato",group=F)
Study: virus in sweetpotato
Student Newman Keuls Test
for yield
Mean Square Error: 22.48917
virus, means
yield std.err replication
cc 24.40000 2.084067 3
fc 12.86667 1.246774 3
ff 36.33333 4.233727 3
oo 36.90000 2.482606 3
alpha: 0.05 ; Df Error: 8
Critical Range
2 3
4
8.928965 11.064170 12.399670
Comparison between treatments means
Difference pvalue sig LCL UCL
cc - fc 11.5333333 0.017638 * 2.604368 20.462299
ff - cc 11.9333333 0.015073 * 3.004368 20.862299
oo - cc 12.5000000 0.029089 * 1.435830 23.564170
ff - fc 23.4666667 0.000777 *** 12.402497 34.530836
oo - fc 24.0333333 0.001162 ** 11.633664 36.433003
oo - ff 0.5666667 0.887267 -8.362299
9.495632
Changes version 1.0-8 (December 01, 2009)
- design.dau: Augmented block design
- upgrade friedman and kruskal-wallis, does not require additional library.
- replace library(corpcor) by library(MASS).
Use PBIB.test()
- durbin.test: ties or no ties.
- design.split: splip-plot design in CRD, RCBD, LSD.
- design.strip: Strip-plot design.
- AMMI: axes are automatic.
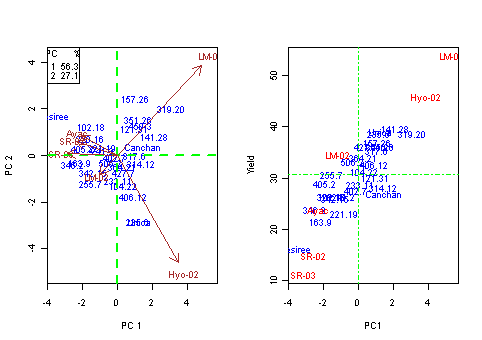
library(agricolae)
data(plrv)
#startgraph
par(mfrow=c(1,2),cex=0.6)
attach(plrv)
model<- AMMI(Locality,Genotype,Rep,Yield,number=F)
detach(plrv)
A<-model$biplot
plot(A[,3],A[,2],xlab="PC1",ylab="Yield",cex=0)
text(A[A[,1]=="GEN",3],A[A[,1]=="GEN",2],rownames(A[A[,1]=="GEN",]),cex=0,col="blue")
text(A[A[,1]=="ENV",3],A[A[,1]=="ENV",2],rownames(A[A[,1]=="ENV",]),cex=0,col="red")
abline(h=mean(A[A[,1]=="ENV",2]),v=0,lty=4,col="green")
#endgraph
Changes version 1.0-7 (April 20, 2009)
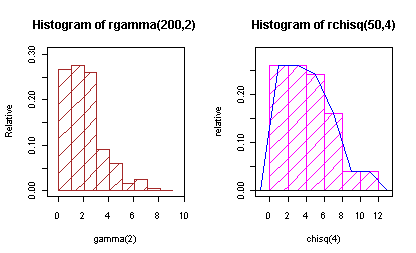
- use plot and summary with graph.freq. class = graph.freq
library(agricolae)
par(mfrow=c(1,2),cex=0.6)
h<- graph.freq(rgamma(200,2),plot=FALSE)
class(h)
[1] "graph.freq"
h1<- hist(rchisq(50,4),plot=FALSE)
class(h1)<-"graph.freq"
plot(h,col="brown", density,frequency=2,density=8,ylab="Relative",xlab="gamma(2)")
title(main="Histogram of rgamma(200,2)")
plot(h1,frequency=2,ylab="relative",col="magenta", density=10,xlab="chisq(4)")
title(main="Histogram of rchisq(50,4)")
polygon.freq(h1,frequency=2,col="blue")
round(summary(h),2)
| Inf | Sup | MC | fi | fri | Fi | Fri |
| 0 | 1.03 | 0.5 | 53 | 0.27 | 53 | 0.3 |
| 1 | 2.04 | 1.5 | 55 | 0.28 | 108 | 0.5 |
| 2 | 3.05 | 2.5 | 52 | 0.26 | 160 | 0.8 |
| 3.1 | 4.06 | 3.6 | 18 | 0.09 | 178 | 0.9 |
| 4.1 | 5.07 | 4.6 | 12 | 0.06 | 190 | 1 |
| 5.1 | 6.08 | 5.6 | 3 | 0.02 | 193 | 1 |
| 6.1 | 7.09 | 6.6 | 5 | 0.03 | 198 | 1 |
| 7.1 | 8.1 | 7.6 | 1 | 0.01 | 199 | 1 |
| 8.1 | 9.11 | 8.6 | 0 | 0 | 199 | 1 |
############### end #############